Fresh news from SatAgro

Datos SatAgro

Satellites – what satellites are available in SatAgro?

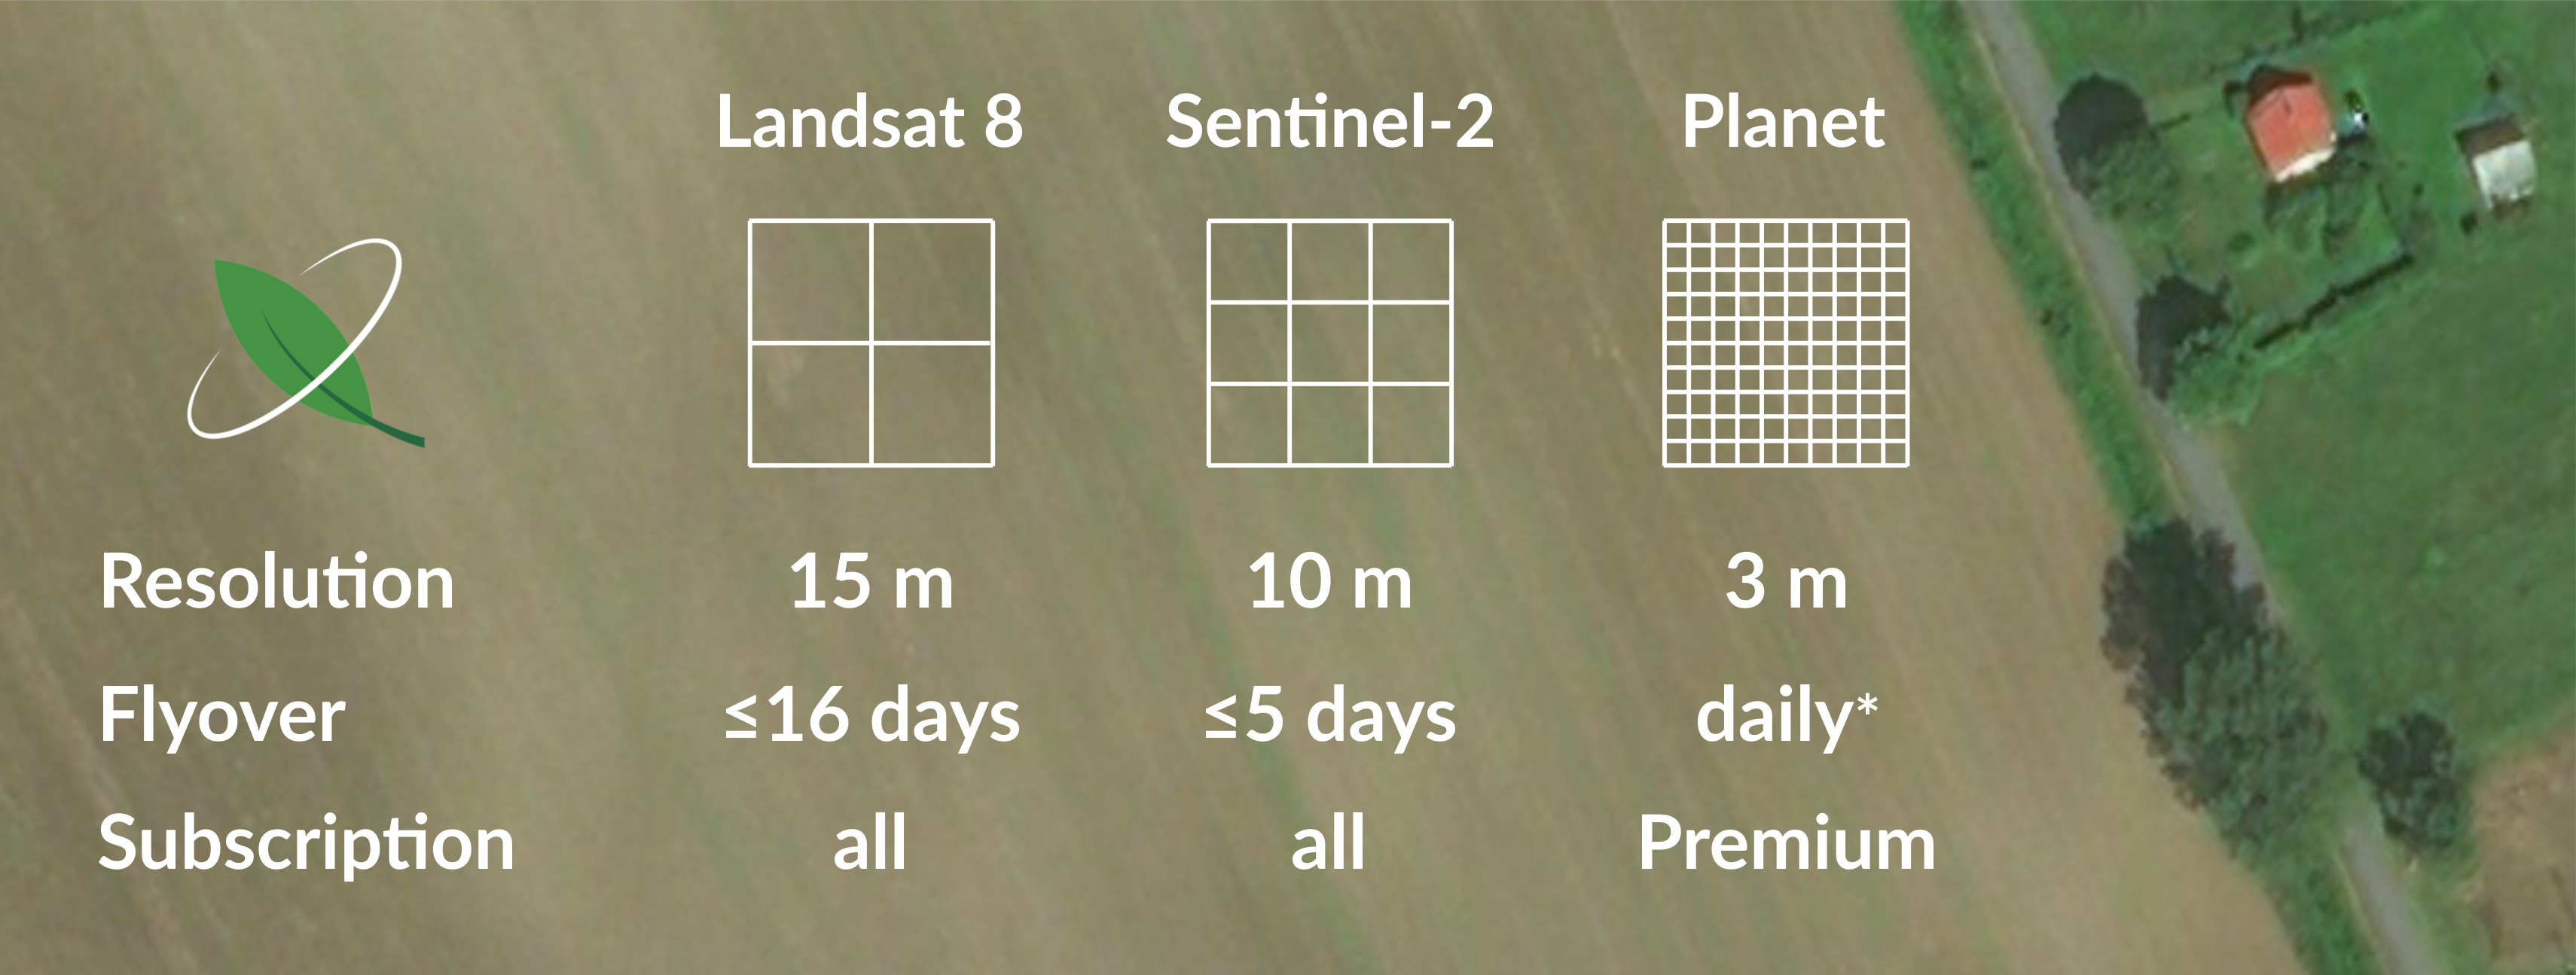
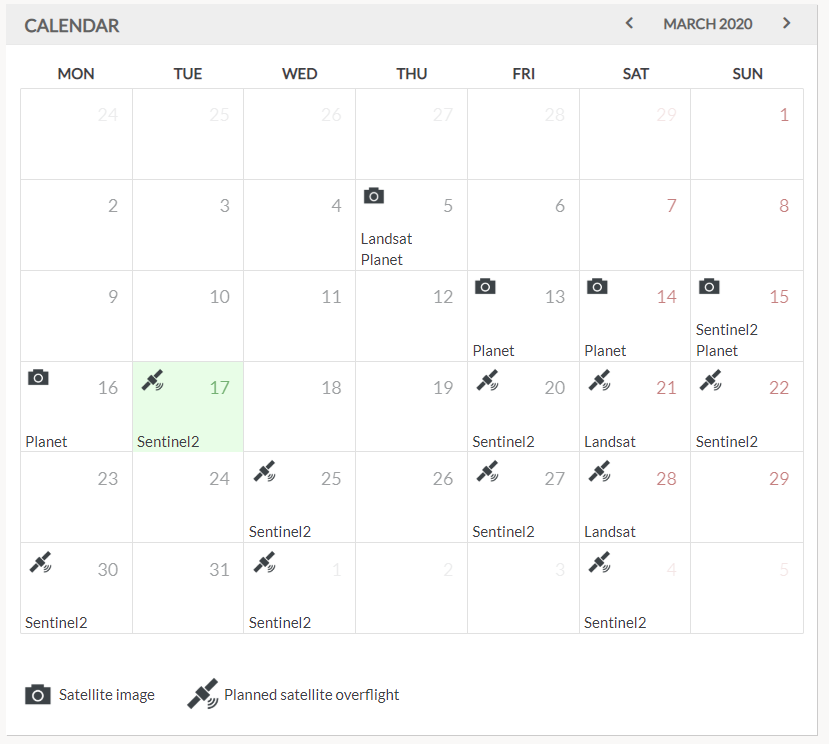
SatAgro aims to make satellite data accessible to all – we develop processing chains for a variety of satellites, transform and process the data as it becomes available and deliver the resulting images, cropped to your fields, to your account. You can see the images in the Explorer tab. A peak behind the scenes: at SatAgro we call these field images “cookies”. The satellite images that can be viewed in SatAgro come from a number of public and private satellites. Satellites available in SatAgro Landsat 8 – launched by NASA and the United States Geological Survey (USGS) in 2013, the satellite…

Weather data

SatAgro’s “Explorer” offers a convenient way to analyze past weather and it’s impact on our farm. The data you can display goes back to the beginning of the century. By default, the timeseries assigned to your field come from the closest publicly available weather station, usually operated by government agencies. To check which station your field has been assigned to, go to the “Field sheet” – the station will be stated in the lower right of the “Monitoring” panel. Premium subscription SatAgro Users who own a private, web-enabled weather station can have weather data integrated with their SatAgro account. If…

Private weather stations

The default weather data source for your fields in SatAgro are public weather stations. However, operating your own weather station is the best way to ensure you have accurate weather data, especially if you are located far away from your nearest public station. At SatAgro, we gladly integrate data from private, web-enabled stations from most manufacturers. Contact us to set up the integration, we will also gladly advise on the various models available in the market.

Satellite images – when do flyovers take place?

State agency scientific satellites are usually placed in orbits, with a height above the planet’s surface of nearly 700 kilometres. A satellite in such an orbit circles the Earth several times a day. Flights over the daily half of the planet take place around 10 AM local solar time. Once launched, the orbit does not change. The satellite orbits at a regular pace. To see planned flyovers, take a look at the calendar on the SatAgro «Desktop»: flyovers are marked with a satellite icon. If we managed to get an image (no clouds), it is recorded in the calendar with a…

Satellite images and the vegetation index – what do satellites measure?

Satellite optical sensors collect information about how the Earth’s surface reflects sunlight. Technically, these sensors have a lot in common with ordinary cameras, but in addition to blue, green and red light, they also register light that is invisible to human eyes. These are primarily different ranges of ultraviolet and infrared light. The technical term for such sensors is «multispectral» – covering many parts of the electromagnetic spectrum. Taking into account light outside the visible range allows us to detect various phenomena. In agriculture, the ratio of Near Infrared to Red reflection is particularly important. An index calculated on the…

Satellite images – what determines the resolution and frequency of satellite images?

There is a trade-off between acquisition frequency and resolution of satellite images. This influences the design of sensors aboard satellites, depending on the intended applications of the data collected. Below, simplified diagrams of the different acquisition frequency and resolution ratios of hypothetical satellites on 3 consecutive days. Low-resolution satellites (e.g. MODIS) sensors collect information in a wide angle, so that a large part of the globe is imaged daily. A single pixel however is very large (200 m+). The data from these satellites are useful as a frequently updated field-wide average (available in the SatAgro «Explorer» tab on the graphs),…